So I was reading the Congressional Budget Office Director's Blog (because that's what bloggers do, right?). CBO Chief Douglas Elmendorf wrote a really interesting post last month about the estimated average federal tax rates we all pay. These numbers fit with the Rachel Maddow report I discussed last April about how Americans under President Obama have one of the lowest federal income tax burdens in modern history. The CBO's numbers cover 1979 to 2007—nuts! no Obama comparisons yet! But they do offer a broader picture by looking at not just federal income tax, but every penny we send Washington-ward. The CBO even includes corporate income tax and employer share of payroll taxes, figuring those taxes all get passed on to households one way or another.
Cool! Hand me that data and let's make some charts:
| persons in household | lowest | second | middle | fourth | highest |
| 1 | $0 | $20,500 | $34,300 | $50,000 | $74,700 |
| 2 | $0 | $28,991 | $48,508 | $70,711 | $105,642 |
| 3 | $0 | $35,507 | $59,409 | $86,603 | $129,384 |
| 4 | $0 | $41,000 | $68,600 | $100,000 | $149,400 |
| 5 | $0 | $45,839 | $76,697 | $111,803 | $167,034 |
| 6 | $0 | $50,215 | $84,017 | $122,474 | $182,977 |
| 7 | $0 | $54,238 | $90,749 | $132,288 | $197,638 |
| 8 | $0 | $57,983 | $97,015 | $141,421 | $211,284 |
| 9 | $0 | $61,500 | $102,900 | $150,000 | $224,100 |
| 10 | $0 | $64,827 | $108,466 | $158,114 | $236,222 |
Table 1: Minimum adjusted income by quintile and household size
First, let's talk quintiles. The CBO numbers divide American households into five equal slices: lowest fifth of income earners, second, middle, fourth, and highest. The above chart shows the minimum amount a household has to make to be considered part of a given quintile.
CBO adjusts income based on the square root of the number of people in the household. Basically, the more people in a household, the more income they need to count as members of the richer group. My three-person family is currently in the second quintile. Add one more child, and we might well drop to the lowest quintile by CBO's count.
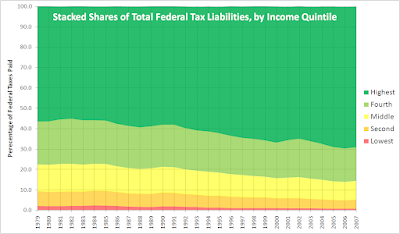
Now that you can figure out which quintile you're in, here's an idea of what the average federal tax burden is for folks in about the same household income situation as you (you'll want to click the chart to make it bigger):
 We see that, as of 2007, overall federal tax burden as a percentage of household income was lower under the Bush Administration than under the Reagan Administration for everyone but the highest quintile (that is, the top-earning 20% of households). Again, as Maddow and real data suggested in April, if folks feel their taxes have been getting higher over the past several years, they can't blame Uncle Sam.
The overall tax rate is neatly progressive, with each quintile paying a larger percentage of its income than the one below it throughout the 28 years surveyed.
 The richest fifth of American households have footed over half the federal tax bill throughout the period CBO surveys. Their share of the tax liability has increased from a minimum of 55.0% in 1982 to 68.9% in 2007. The biggest chunk the lowest 20% paid was in 1984: 2.4% of Uncle Sam's tab. Since 2004, the lowest quintile's share has been less than 1%.
Of course, you'd expect the richest fifth to pay a bigger chunk of the tax bill, since they have a bigger chunk of the money, right?
 Indeed, but note, fellow Marxist plotters: the highest quintile has a smaller share of the nation's income than their share of the federal tax liability. That top fifth do take the lion's share, increasing their take from 45.5% of the nation's income in 1979 to 55.9% in 2007. Conversely, the bottom quintile earns a larger chunk of the national income than its share of the federal tax liability. but their share of the wealth has dropped from 5.8% in 1979 to 4.0% in 2007.
Interestingly, over the same span, the other three income quintiles have each seen their share of the national income drop by 2.7 percentage points. The difference may not be much, but the only people getting a bigger piece of the pie since the Reagan years are the richest Americans.
Consider also the percentage increases in average income for each quintile since 1979, adjusted for inflation:
- Lowest quintile: 11%
- Second quintile: 18%
- Middle quintile: 19%
- Fourth quintile: 29%
- Highest quintile: 89%
These numbers show that the recent historical trend is for a lower federal tax burden for everyone. As intended in a progressive tax scheme, the rich shoulder by far the greatest portion of those taxes. Their share of taxes exceeds their share of income, but the rich are claiming an increasing share of the national wealth, leaving every group beneath them with smaller slices of the American pie.


 This blog printed on 100% recycled electrons.


You ought to see what the tax brackets looked like during the Eisenhower administration. America prospered then anyway. I actually remember some of it (not the prosperity as such, but I did get to sit in the cockpit of a B-52).
ReplyDeleteI see only one big problem with the current theory of wealth redistribution. It seems to assume that "the wealth" is some fixed constant that can be shuffled around, some ways more fairly, some ways less fairly. It seems to neglect the notion that wealth can not only be moved around, but created (or destroyed). We are not playing a zero-sum game.
If we tax the investor class to death, then might we end up with less overall wealth to "spread around"? Will we then find ourselves trying to figure out how to best distribute poverty instead?
If we are to see higher taxes down the road, I'd prefer raising the tax percentages at the upper income levels, rather than implementing some massive new tax such as a carbon tax or value-added tax. I would also favor:
(a) Indexing tax brackets for inflation
(b) Raising the retirement and social security collection age to 70
(c) "Means testing" for social security benefits
(d) Raising the income cap for the payroll tax and self-employment tax
And last on my list, but perhaps foremost in importance:
(e) Passing a constitutional amendment forcing the federal government to balance the budget every year
Now that I've put forth all these liberal proposals, the conservative in me would still rather stay away from all tax increases -- cut spending and whittle down the size of government at all levels instead. But I do realize that this sentiment may arise less out of logic and more out of passion, or some artifact of my upbringing (Republican, strict Christian, you know).
Thanks for taking the time to think that through, Stan. I think I could come to agree with you on each one of your five proposals. I see no reason not to pass a balanced budget amendment, except maybe with a provision for extraordinary circumstances (4/5 vote to use deficit spending for stimulus or war?).
ReplyDeleteOn taxing the investor class: I think I heard on the radio yesterday an argument that when taxes on rich folks are too low, they just pocket the cash, buy some fancy stuff, and that's it. Raise their taxes, and they are more likely to sink their money back into their businesses, which supposedly creates more economic activity and gets more money in more people's pockets. It's still wealth redistribution, but their business gets bigger and better, and the economic pie gets bigger, so they don't feel like they've been hit with Marxist redistribution. Any sense to that?
I think it makes sense. It's what "Trickle Down Economics" should have been. Not what was done.
ReplyDeleteI've never heard the reasoning you've given but I do know that the opposite is true for the lower incomes. The less tax they pay, the more money they spend (most people). Those in the higher income brackets see paying less in taxes as a way to get more income. You know how it's said "He didn't get rich by spending money."
Jim, I wonder if the difference in the economic stimulus we get from increasing money in lower-income folks' pockets is that lower-income folks have lots of pent-up demand for immediate purchases. They've been scrimping, saving, doing without; give them a raise or a bigger tax refund, and they run right out and get the car fixed, buy new work boots, see the doctor about that aching shoulder, etc. Give the rich a tax break, and they don't rush out and buy stuff, since they already have most of what they need. They have more wiggle room to gamble on the market and fuel speculative bubbles.
ReplyDeleteThe other day, I read an article on one of the major news sites (I forget which one) to the effect that some banks are once again offering loans to people who likely cannot pay them back.
ReplyDeleteWhile we can blame the big money folks for speculative bubbles, we must not forget: As the plankton go, there go the whales. (Not sure how well that analogy really applies here, but it sounds sort of cool, doesn't it?)
I hope Obama comes out and admonishes people to avoid getting themselves into toxic debt. However, he, like his predecessor, may find that task rather difficult to carry out without coming off as a hypocrite.
Somehow, somewhere, we've gotta get a grip on all this. Cory, I'd accept the provision for a 4/5 majority override to allow "emergency exceptions" to my proposed balanced-budget amendment, but first we'd have to clearly define the meaning of the term "emergency."
define "emergency"—now there, Stan, is the kind of challenging question that makes legislating fun! Let's go to Pierre and do it!
ReplyDeleteI agree that we should not hand loans to people who can't pay them back. But don't forget my earlier post about rich folks skipping out on mortgages at higher rates than less-rich folks.
But yes, we all need to get a grip on our government and resolve the budget issue. And as neighbor Jackie pointed out the other day, one of the biggest drains on our budget is a defense budget that arguably is throwing lives away in Afghanistan.